Monday, May 17, 2021

Gold Trends (14 May 2021) - Updates of Mib Agenti


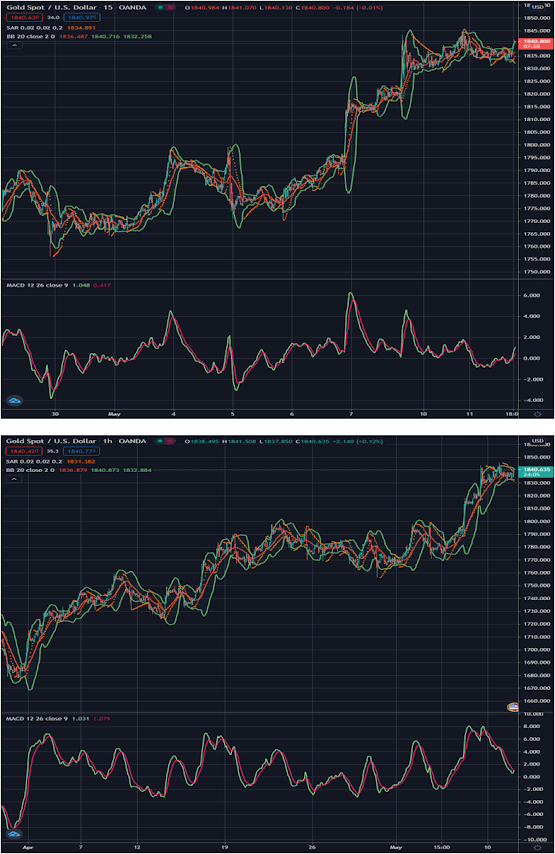
Charts - excerpts from tradingview.com

The 15 mins charts are newly negative and the target is $1796 with technicals at mid-levels contrary to price action. It needs strong selling to send it below $1814 by NY open to reinforce it, or it decays. To pull it up to positivity needs it to be bought and kept above $1848 and the target shifts to $1867.

The hourly charts positivity were revived and the target is $1888 and the technicals at mid-high levels. Without good volatilities it’s struggling, but rekindled if pinned above $1855 by London p.m. fix. To slam it to negativity needs gold to be sold and pressured below $1804 and the target is $1776.

Do watch the global markets for your next clues.

Wednesday, May 12, 2021

Gold Trends (12 May 2021) - Updates of Mib Agenti


Charts - excerpts from tradingview.com

The 15 mins charts are barely positive and the target ought to be $1873 with the technicals at mid-low levels and backsliding, its degrading. Pinning it above $1853 by NY open to resurects it. To usher it to negativity needs firm selling pressure and subdue it below $1820 and the target shifts to $1798.

The hourly charts are newly positive from time decay with the target $1895 and the technicals are at mid-high levels, but not rising, feels lethargic here. Its revitalised if kept above $1864 by London p.m. fix. To force it to negativity needs it to be sold and suppressed below $1811 and the target is $1786.

Do watch the global markets for your next clues.

Tuesday, May 11, 2021

Gold Trends (11 May 2021) - Updates of Mib Agenti


                                                Charts - excerpts from tradingview.com

The 15 mins charts are positive and the target is $1876 with technicals at mid-levels but feels tender and if drifts from the highs, it wavers and decays. Its re-energised if pushed above $1854 by NY Open. To drag it back to negativity needs it to be sold and suppressed below $1822 and the target is $1802.

The hourly charts are negative and the target is $1786 and the technicals at mid-levels but resolve is weakening and could be overrun. To get reinvigorated, needs to send it below $1822 by London p.m. fix. To pull it into positivity needs good buying to lift and pin it above $1867 and the target is $1893.

Do watch the global markets for your next clues.


Monday, May 10, 2021

Gold Trends (10 May 2021) - Updates of Mib Agenti


Charts - excerpts from tradingview.com

The 15 mins charts are although positive and the target is $1874 with technicals at mid-levels but volatilities are low, so pushing higher might be limited. Its reenergised if pushed above $1853 by NY Open. To pull it to negativity needs it pressured and subdued below $1820 and the target is $1800.

The hourly charts are negative and the target is $1785 and the technicals at high-mid levels but price action contradicts it and slight decay is creeping in. It revitalised if kept below $1815 by London p.m. fix. To pull it to positivity needs gold to be bought and pinned above $1862 and the target is $1898.

Do watch the global markets for your next clues.

Friday, May 7, 2021

Gold Trends (07 May 2021) - Updates of Mib Agenti


Charts - excerpts from tradingview.com

The 15 mins charts are negative and the target is $1787 with technicals at mid-levels but volatility is ultra-low, contraring price action. It needs to be sent below $1805 to be reaffirmed by NY open, or it decays. To flip it to positivity, needs it chased and kept above $1835 and the target shifts to $1858.

The hourly charts are negative and the target is $1770 and technically coming off the highs, faster moving than price action and fixated around $1820. Its refreshed if kept below $1798 by London p.m. fix. To pull it to positivity needs good buying and pin it above $1846 and the target is $1880.

Do watch the global markets for your next clues.


Gold Trends (06 May 2021) - Updates of Mib Agenti


Charts - excerpts from tradingview.com

The 15 mins charts are negative and the target is $1761 with technicals at mid-levels with ample room but without any follow through, its wedged in here. Its reaffirmed if kept below $1776 by NY Open. To pull it to positivity, needs it to be bought and hung above $1806 and the target is $1828.

The hourly charts are positive but retreating, with a target of $1841 and technicals just above mid-high levels but decay is creeping in and needs buying to send it above $1817 by London p.m. fix to revitalise it. To pull it to negativity needs it sold and subdued below $1756 and the target is $1740.

Do watch the global markets for your next clues.

Wednesday, May 5, 2021

Gold Trends (05 May 2021) - Updates of Mib Agenti


Charts - excerpts from tradingview.com

The 15 mins charts are freshly positive but looking a tad heavy. The target is $1812 with technicals just below mid-levels and needs fresh buying to lift it above $1793 by NY open to revitalise it. To drag it back to negativity needs it to be sold and kept below $1754 and the target shifts to $1733.

The hourly charts are faintly negative and the target is $1720 and the technicals at mid-levels as time decay is wearing it down. It has to be suppressed below $1741 by London p.m. fix for reaffirmation. To sling it back to positivity needs it to be bought and pinned above $1803 and the target is $1827.

Do watch the global markets for your next clues.

Tuesday, May 4, 2021

Gold Trends (04 May 2021) - Updates of Mib Agenti


Charts - excerpts from tradingview.com

The 15 mins charts’ negativity is waning and the target is $1745 with technicals at mid-low levels and if it refuses to break lower, may trigger a reversal. To revitalise it, needs kept it below $1766 by NY open. To force it to positivity needs it to be bought and kept above $1797 and the target is $1818.

The hourly charts are negative and the target is $1730 with technicals at mid-high levels,  with room for lower but volatility is dwindling, underpins it. Its reaffirmed if it gets below $1758 by London p.m. fix. To shoot it to positivity needs firm buying to hang it above $1806 and the target resets to $1835.

Do watch the global markets for your next clues.

Monday, May 3, 2021

Gold Trends (03 May 2021) - Updates of Mib Agenti


Charts - excerpts from tradingview.com

The 15 mins charts are mildly positive and the target is $1813 with technicals at high-mid levels but not rising quickly, might attract profit takers here. Its reaffirmed if pushed above $1794 by NY Open. To sway it to negativity needs firm selling to keep it below $1762 and the target switches to $1745.

The hourly charts are positive and the target is $1835 with technicals at mid-high levels, so has room to run higher if it desired but lacks volatility. Its revitalised if kept above $1806 by London p.m. fix. To weigh on it and turn it negative needs it sold and subdued below $1755 and the target is $1733.

Do watch the global markets for your next clues.


Gold Trends (30 April 2021) - Updates of Mib Agenti


Charts - excerpts from tradingview.com


The 15 mins charts are negative and the target is $1733 with technicals at mid-low levels, being rangebound, restricts moves either direction. It’s reaffirmed if subdued below $1755 by NY Opening. To pull it back to positivity needs it to be bought and pinned above $1791 and the target is $1814.

The hourly charts are neutral, resynchronising and ponders its next move. If good volatilities arise, pulling it to positivity needs buying to lift it above $1806 by London p.m. fix and the target is $1825. To suppress it to negativity needs it slammed and kept below $1747 and the target shifts to $1720.

Do watch the global markets for your next clues.

Thursday, April 29, 2021

Gold Trends (29 April 2021) - Updates of Mib Agenti


Charts - excerpts from tradingview.com

The 15 mins charts are negative and the target is $1734 with technicals at low-levels, pushing lower maybe hindered and stabilise here. Renewed selling to keep it below $1760 by NY open rejuvenates it. To pull it to positivity needs gold to be bought and pinned above $1793 and the target is $1815.

The hourly charts are negative with the target of $1722 and the technicals just above mid-levels but bereft any follow through selling so it ranges. To reinvigorate it needs it kept below $1753 by London p.m. fix. To flip it back to positivity needs it raced and kept above $1806 and the target is $1829.

Do watch the global markets for your next clues.

Wednesday, April 28, 2021

Gold Trends (28 April 2021) - Updates of Mib Agenti


Charts - excerpts from tradingview.com

The 15 mins charts are feebly negative and the target is $1727 with technicals at mid-low levels and needs renewed selling to void the slightly growing degradation, by sending it below $1750 by NY Open. To coerce it to positivity needs it to be bought and kept above $1784 and the target is $1800.

The hourly charts are nicely negative the target is $1715 and the techincals just below mid-levels with lots of room for lower, but pushing slowly, it may decay. Its reaffirmed if kept below $1738 by London p.m. fix. To lift it to positivity needs buying to pin it above $1794 and the target is $1815.

Do watch the global markets for your next clues.


Tuesday, April 27, 2021

Gold Trends (27 April 2021) - Updates of Mib Agenti


Charts - excerpts from tradingview.com

The 15 mins charts are feebly positive and the target is $1816 with technicals are at mid-low levels but volatilities are fading. Fresh buying is needed to lift it above $1796 by NY open to reaffirm it or it dithers. To tip it to negativity needs it to be sold and subdued below $1760 and the target is $1738.

The hourly charts are positive via time decay and the target is $1827 and the technicals at mid-levels, calm before the storm? It needs renewed volatility to pin it above $1805 by London p.m. fix to refresh it. To slam it to negativity needs it sold and kept below $1720 and the target shifts to $1747.

Keep your eyes on the global markets for your next clues.

Thursday, September 14, 2017

Gold Trends (14 September 2017) - Updates of Mib Agenti

In the daily charts, the short term directional indicators have descended to around the 40% mark now but gold didn’t move in a similar fashion.  

So it would seem that the 1320 is holding the market well and helping to stabilize it here. 

It will be good if the market is able to maintain below the 1330 but above the 1320, then in all likelihood, the indicators will creep nearer to the oversold region and from there managed to do a turn around, then the market stands a good chance to push back nearer the recent highs. 

The medium term trending indicators are erasing gains swiftly and corrected by almost two thirds and with a slightly higher chance that the indicators will try to push lower from here, targeting the parity line and if all goes accordingly, then the earliest the parity line will be challenged will be next mid-week. 

The long term directional indicators are in the channel now and it will take at least a week before the new direction emerges. 

The channel is now sloping down sharply but luckily the bottom band is helping to hold gold here as that acts as a psychological barrier and in order to break through requires a forceful action, usually on the back of some major news. 

So gold will likely consolidate temporarily and the next gust will determine which direction it will be blown. 
.
The momentum/volatility indicators are sputtering at the moment as the descent seem to have grown some brakes, lower by only a notch from the previous day. 

The positive bias gave up some ground slightly quicker than expected, but likely not in danger of being negated this week as the gap is still wide enough to withstand some selling, but if gold closes below 1300 for the week, then the bias will be negated and turn negative.


Interim supports are at 1317, 1303 & 1297.60 with minor supports at 1315.50, 1303.60 & 1298.30.

Interim resistances are at 1328.50, 1334.50 & 1351.50 with minor resistances at 1335.50, 1338 & 1352.


The daily/weekly trend changer points are at 1354/1231.50.


Wednesday, September 13, 2017

Gold Trends (13 September 2017) - Updates of Mib Agenti

In the daily charts, the short term directional indicators have continue sliding lower and around the 58% level now, losing over 25% as the lows of around 1323 were tested yesterday. 

These indicators will likely continue pressuring the complex lower as it still have some length beneath that could be taken advantage of.  

As the earlier run lower was swift and forceful, that is, a low of 1323 was achieved, looking at the height of the indicators now, could mean that 1320 might not be able to hold back the march lower unless some fresh rumblings come into play. 

The medium term trending indicators continue to point lower, and have lost about 50% of its earlier gains. 

However it is still days away from reaching the parity line and without any new disturbances, the parity line could be challenged at the earliest, by next Wednesday. 

The long term directional indicators are breaching the channel and piercing right into it, with the channel sloping downwards quite steeply. 

However, it is only conclusive if at the closing, it remains thus, unless gold closed back above the 1330’s and it then becomes a near miss again. 

So a closing below 1320 will confirm that the direction is negated and some consolidation is required before the fresh direction becomes apparent. 

The momentum/volatility indicators are being slam dunked and lost many notches making for difficulty to hold the attention in any particular direction for too long. 

The positive bias strangely managed to stem the losses and trying to ward off the crashing through of the 1320 level as the gap somehow started stabilizing and holding it steady.

Interim supports are at 1320, 1313.50 & 1305 with minor supports at 1315.50, 1303.60 & 1301.

Interim resistances are at 1331.50, 1335.50, & 1350.50 with minor resistances at 1335.50, 1352 & 1380.80.


The daily/weekly trend changer points are at 1356.15/1231.50.


Tuesday, September 12, 2017

Gold Trends (12 September 2017) - Updates of Mib Agenti

In the daily charts, the short term directional indicators are sliding down furiously due to there being little rumblings recently and around the 73% level now. 

As it is coming off steeply, gold may have difficulty staving off further loses as it tries to find some support along the way down, hoping to hold it steady and try to turn it back to the higher side thereafter. 

The medium term trending indicators are looking even more set to ensure that it does go lower and some chance we could test the parity line by the week’s end, translating to the 1300’s being tested. 

That is, if the market is run on just one indicator but that is not the case so all other indicators must also be taken into considerations. 

The long term directional indicators are a lot nearer to the bottom rung of the channel as the gap has narrowed a lot in yesterday’s session and needs gold to close below 1220 in order to negate the current direction. 

However, this is especially a tough job to end it, this past month a half as it managed to touch and not confirm and instead started widening up again the next day. 

This time round is no exception and the indicator might come so close and even to the point of touching the bottom of channel from below, but then start gapping away from the channel the next day, especially if it didn’t manage to breach and close with the direction negated. 

So a lot of watching and seeing plus patience is required in order to plan the next move. 

The momentum/volatility indicators are losing ground very rapidly and now back into the warm zone but luckily not too far in yet and a revival from here is a lot easier than if it had gone to lukewarm zone. 

The positive bias is still too wide and likely not be contraed these couple of days a lot it has continued narrowing, but gradually.

Interim supports are at 1315, 1311 & 1303 with minor supports at 1315.50, 1303.60 & 1301.

Interim resistances are at 1333, 1338.50, & 1352 with minor resistances at 1338, 1352 & 1380.80.


The daily/weekly trend changer points are at 1357.55/1231.50.


Monday, September 11, 2017

Gold Trends (11 September 2017) - Updates of Mib Agenti

Having been called away the past 2 weeks at the last minute, I was not able to pre-warn of my absence.  

Thanks to the many global rumblings egged gold higher and higher, culminating with a high of almost 1360, not a bad effort at all. 

As the market rose steadily on the rumblings, the “legs” could easily go limp quickly once the rumblings stop or if the perceived danger is deemed to have cooled off and for now, and the only way for gold to prick the year’s high is for new rumblings to emerge. 

In the daily charts, the short term directional indicators have performed below par even as gold tested so much higher, it did not manage to surge past the previous peak and have now, turned back lower and bearing down just below the overbought region and is long overdue for some correction to take place. 

The medium term trending indicators did shoot past the earlier peaks comfortably by at least 50% but have now cut and turned down. Due to the acute gradient, if no new catalysts come into play over the next 2 days, gold could be thrashed heavily and 1320 could be impacted. 

The long term directional indicators are maintaining a huge gap to the bottom of the channel and gold needs to trade till 1310 and close below that in order to negate the direction. 

Seen currently, could be an early indication that the channel is trying to level off but gold could likely try to hold the mid-range levels as long as it possibly can in order for all the other indicators to re-synchronise itself before deciding on its next move. 

The momentum/volatility indicators are sharply declining as it heads back lower but it is still in the hot zone so given the correct incentive, it could easily reverse and another major move in the offing. 

The positive bias gap was narrowing the past 2 days but only marginally.

Interim supports are at 1332.50, 1328.50 & 1308.50 with minor supports at 1327.80, 1315.50 & 1303.60.

Interim resistances are at 1343, 1356.50 & 1359 with minor resistances at 1338, 1352 & 1380.80.


The daily/weekly trend changer points are at 1330.95/1231.50.


Saturday, August 26, 2017

Gold Trends (25 August 2017) - Updates of Mib Agenti

In the daily charts, the short term directional indicators curtailed pushing lower and are in a holding pattern just as it nears the 50% level. 

If it stopped pushing lower, then there is a fair chance the indicator could manoeuvre a about turn from here, which is a lot better then turning around when it was around the 70% mark translating into having more space to test higher than the latter. 

However, the closing is crucial determinant where it will head the earlier part of next week. 

If it closes above 1294, then 1300 could be tested and conquered but if it closed below 1280, then it had failed in the attempt. 

The medium term trending indicators are not yet convinced and continue to look pressured and needs gold to test and close above 1300 in order to wipe the disbelief clean away and turn it back upwards. 

The long term directional indicators are very near to the channel which have flattened its trajectory and could be easily pierce back into the channel if gold pushes and closes below the 1277 level, putting an end to the direction and set in motion some cooling off time. 

The momentum/volatility indicators are still maintaining without gain or losses and not far from the red zone so it needs some help to push it just a wee bit more and we see some good moves and new range set. 

The positive bias continues narrowing marginally but is still not in danger of being cancelled as the gap is still too wide.

Interim supports are at 1285, 1274 & 1270 and minor supports at 1282.50, 1278 & 1270.60.

Interim resistances are at 1295.50, 1309 & 1320.50 and minor resistances are at 1291.40, 1305.90 & 1309.90.


The daily/weekly/monthly trend changer points are at 1275.85/1210/1301.60.

Thursday, August 24, 2017

Gold Trends (24 August 2017) - Updates of Mib Agenti

In the daily charts, the short term directional indicators have dribbled to the 54% mark now while gold is managing to keep holding above the 1280’s. 

Should the indicators continue on its path lower, preferable if it can sink to at least 30% mark, but at the same time with the gold holding firm, will place itself in a good position when the indicators eventually turn back up and higher and gold will be easily pulled along for the ride and with plenty of scope on the upside after that. 

The medium term trending indicators are managing to come off a little only, and looks more like the market is drooling instead of being bashed lower in one swift strike. 

It is apparent that there are strong undercurrents at play now and the victor is the one with the stronger hand and if sufficient fundamentals are on its back, pushing it along. 

The long term directional indicators are much nearer to the bottom of the channel now but could be 2 days, at the earliest, that the gap has any chance of being closed and direction compromised. 

Perhaps what could be a detriment is the channel has levelled off now and if no new highs are made in the next week, or if gold closes below 1275 at the week’s ending, that is, whichever comes first, the indicator would manage to close the gap and direction neutralised. 

The momentum/volatility indicators are somehow managing not to decline and holding steady at the moment. 

We need new catalysts to tip it over the red zone and hopefully set the market running. 

Gold has been boring for the past week, preferring to keep to narrow ranges but to the delight of the range traders. 

The positive bias continues narrowing but only marginally but is in no danger of being negated this week, that is, unless gold was driven to 1230’s or lower.

Interim supports are at 1284.50, 1273.50 & 1270 and minor supports at 1282.50, 1278 & 1270.60.

Interim resistances are at 1293.50, 1308.50 & 1320.50 and minor resistances are at 1291.40, 1305.90 & 1309.90.

The daily/weekly/monthly trend changer points are at 1273.70/1210/1301.60.


Wednesday, August 23, 2017

Gold Trends (23 August 2017) - Updates of Mib Agenti

In the daily charts, the short term directional indicators were not successful in its attempt to stop looking weaker and didn’t manage to cut back across and higher. 

The indicators today continue sliding a little more lower and around the 60% mark and an early indication that it would likely continue correcting and resynchronising. 

The major benefit being, although the indicators are being pulled back, we do not yet see a corresponding move in gold and once the indicator has corrected sufficiently to at least the 30% mark, and managed to turn around from there with gold keeping above 1280’s, that could well send gold towards 1300 and higher. 

The medium term trending indicators are pulled towards the parity line now and without any major geopolitical events shaking the market, confidence in gold looks shaken for now and targeting the 1250’s could be a reasonable expectation in the next week. 

The long term directional indicators are still underpinning the market but the gap to the channel narrows more today with the channel almost horizontal, like it is losing trajectory. 

This also puts a top to the move for now and could become a bugbear should the market challenge the recent highs again and the only way to wash it away would be for gold to close preferable above at least 1295. 

Then to help totally erase all traces of that, a closing above 1302 will likely guarantee that and we could push towards 1320 thereafter. 

The momentum/volatility indicators are just maintaining and keeping near to the red zone, about 5 notches to push it there. 

The positive bias is losing ground at a slower pace today and not unreasonable should it start to widen again from here but hopefully with the momentum in the red zone so that we can break  out of recent ranges which have become stale now.

Interim supports are at 1283.50, 1273.50 & 1269.50 and minor supports at 1282.50, 1278 & 1270.60.

Interim resistances are at 1293.50, 1308.50 & 1320 and minor resistances are at 1291.40, 1305.90 & 1309.90.

The daily/weekly/monthly trend changer points are at 1271.35/1210/1301.60.